
Python is open source and it has a lot of libraries. So there are a lot of deep-rooted fans about Python in all over the world. it will be as popular as R and MySQL in the data analysis area.
I tried to express the transition of the population of India with a heat map by Python.
My coding environment is Python3 + Jupyter Notebook, Windows.
About Data
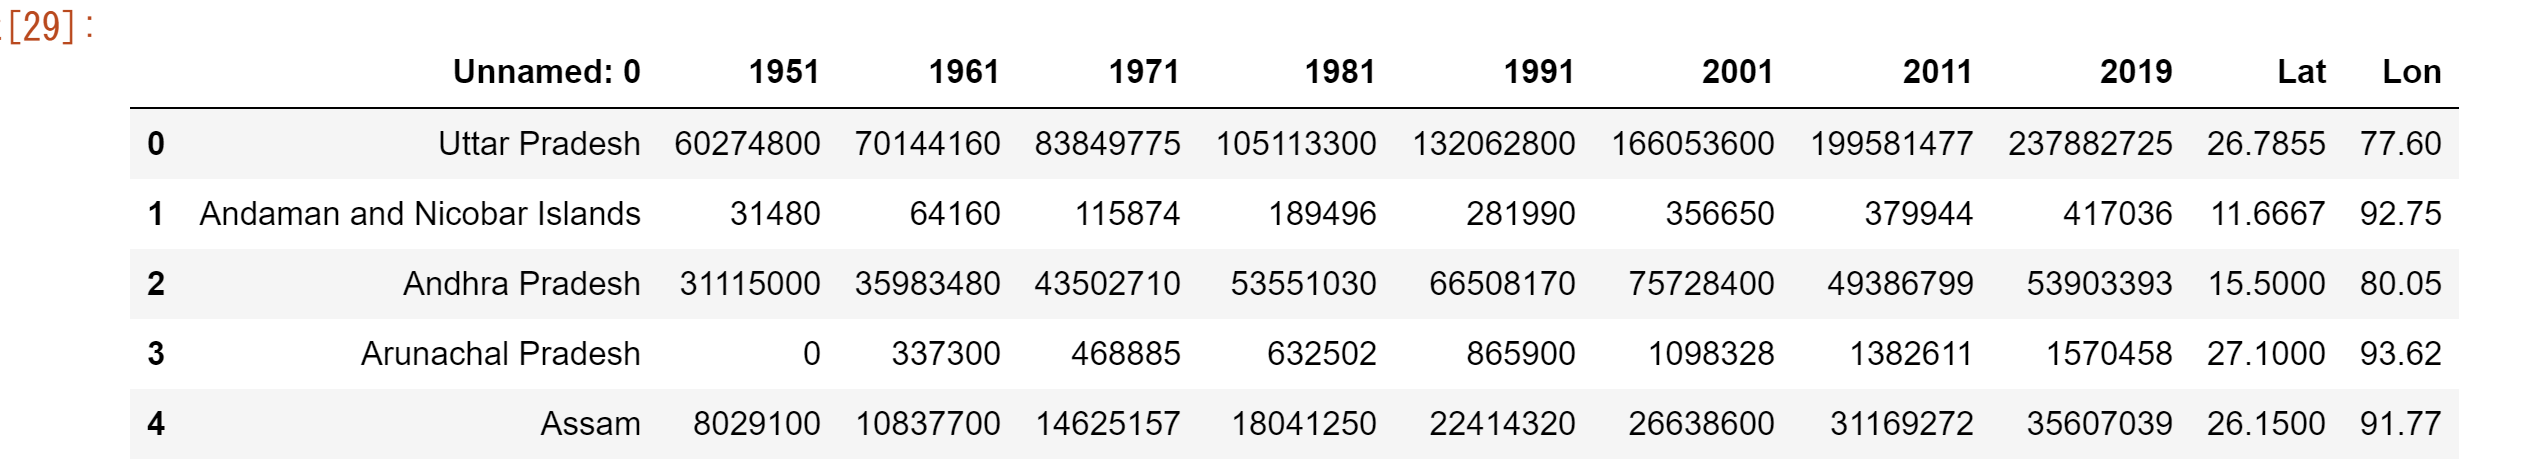
I used data from Wikipedia’s Indian population.
Reffer:List of states in India by past population(Wikipedia)
Population data for each state is available every 10 years from 1951 to 2011 . And 2019.
The center of each state (the center of the heatmap circle) is the location of the state capital or the appropriate coordinates within that state.
There are some states where weren’t in India before, but I haven’t considered it in detail because the main theme is to create heatmaps in Python.
Code
|
1 2 |
#Install of Library import pandas as pdimport foliumfrom folium import plugins |
|
1 2 3 |
#Install of Data population_df = pd.read_csv("OneDrive/IndianPopulation.csv",encoding="shift-JIS") population_df.head() |
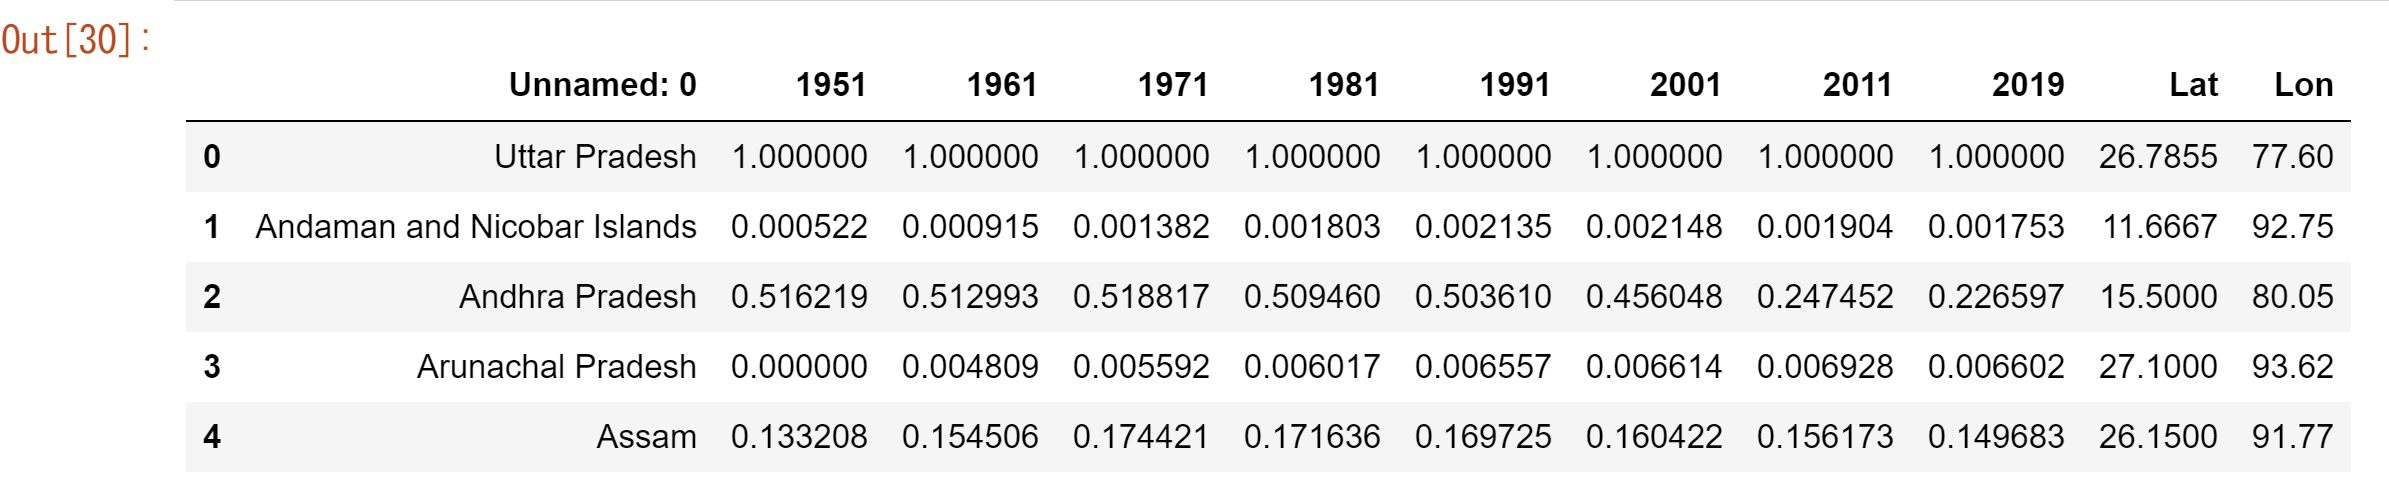
Next I calculated the percentage of the population in each state each year.
|
1 2 3 4 5 6 7 |
#Time Index time_series = ["1951","1961","1971","1981","1991","2001","2011","2019"] #the percentage of the population in each state each year for year in time_series: population_df[year] = population_df[year]/max(population_df[year]) population_df.head() |
Finally, I put the data on the map.
|
1 2 3 4 5 6 7 8 |
#Plot List heat_data = [[[row['Lat'],row['Lon'], row[year]] for index, row in population_df.iterrows()] for year in time_series] #Put Data on Map India_map = folium.Map(location=[20.5937,78.9629], zoom_start=5) hm = plugins.HeatMapWithTime(heat_data,index=[year for year in time_series],auto_play=False,radius=40,max_opacity=1,gradient={0.1: 'blue', 0.25: 'lime', 0.5:'yellow',0.75: 'red'}) hm.add_to(India_map) India_map |
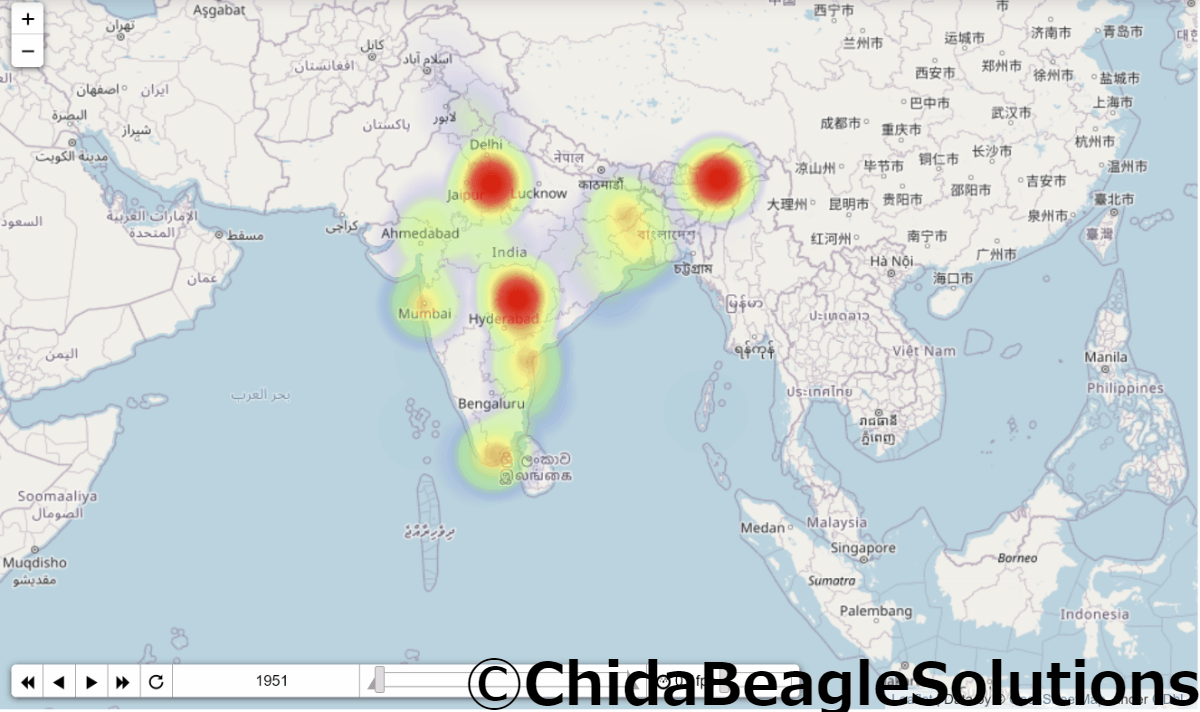
This is a result.
Yeh cute hain.
The problem with this figure is that it is a yearly ratio of each states so even if the population is increasing , it will not be displayed as increased (more red) in the above figure unless the population ratio in India is increasing.
For example, the population of Maharashtra, where Bombay is located, was 32,002,500 in 1951 and 123,144,223 in 2019, a nearly four-fold increase. (I’m surpsised at The population of Maharashtra is as many as Whole Japan!)
the redness of Maharashtra has not changed so much.
Beacause the population growth of Maharashtra is not so much ,compared to the population growth of India as a whole.
Also, because Delhi is so much crowded in India, so Delhi is bright red and other cities are less noticeable.
CHIDA BEAGLE SOLUTIN is also working on the data visualization of such data. Please feel free to contact us if you have any questions!